Moving from Logs to Metrics
Table of Contents
Long story short, at ShipHero we’ve moved away from using logs to debug our software and are all-in on using metrics — Honeycomb, OpenTelemetry-based specifically!
It’s one of those things that in hindsight seems easy to do, something that we should have done years ago, and that’s a no-brainer for any new project. But if you’ve been around software long enough you’ll understand why so many things seem easy in hindsight and super hard at the time.
There’s probably nothing that you can do with metrics that you can’t do with logs if you get creative enough, but I do think that the effort to get to the same place is much lower and more sustainable when using metrics.
What I Mean by Logs and Metrics#
Before I go into the specifics, let me explain a bit what I mean by “logs” and “metrics” here, because they often mean very different things to different people.
Logs, in this case, means application logs — written out to a file by our code, sometimes in a predictable format like structlog, but often it’s just a string bashed together by a frustrated developer seven years ago. (There are system logs, HTTP server logs, DB logs, and many others, but those aren’t the ones we moved away from.)
Metrics, in this particular case, means traces — predictable collections of key/value pairs that can be easily queried.
Why It Matters#
Millions of orders are shipped through our system every month. Every single one of them has to interact with several external APIs (usually between 6–10 different platforms). They make crucial transactional changes (like decreasing available stock internally and externally), generate files, billing data, tracking numbers… it’s a long list of things that have to go right.
And when you do a long list of things millions of times, sometimes they’ll go wrong.
This is a simple view of what that looks like:
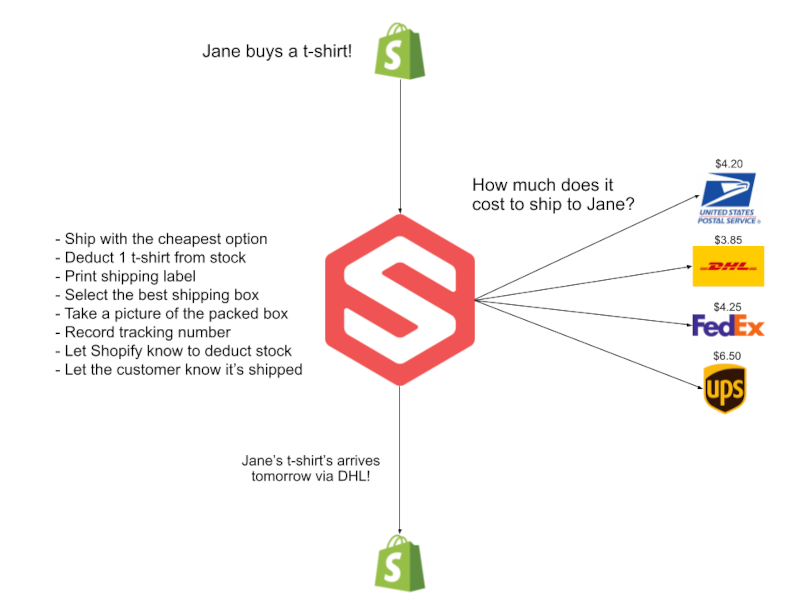
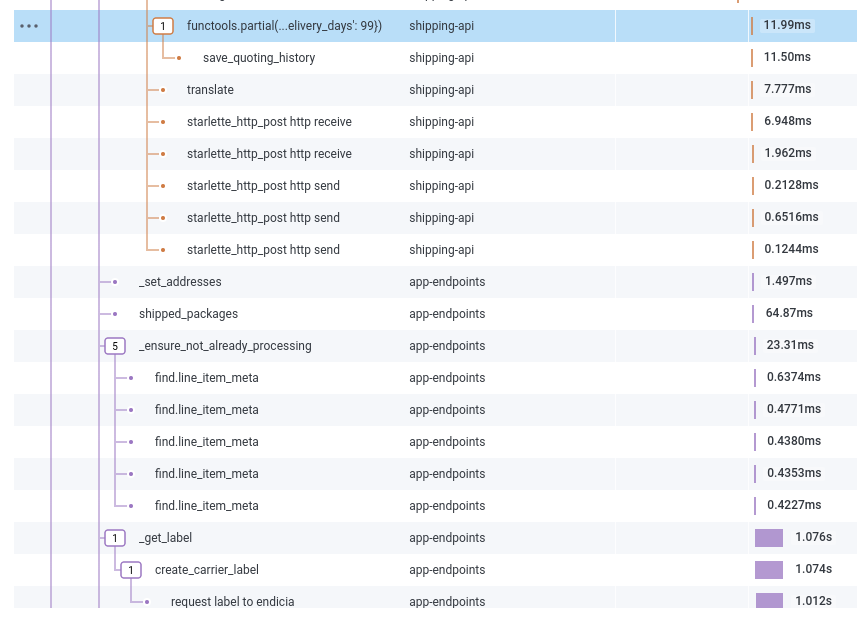
Here’s the breakdown of what that looks like from our instrumentation’s point of view, where we can zoom in and out as needed:
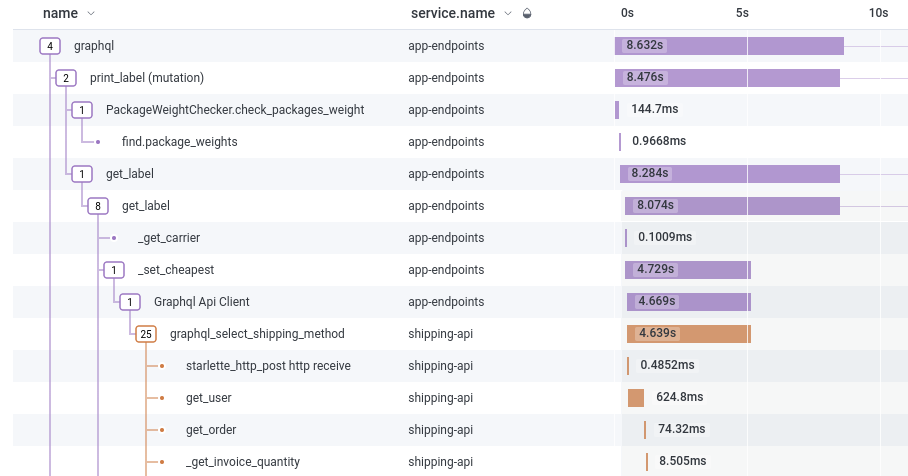
You can see above the request kicks off with a GraphQL request, validates that the weight of the package is statistically close to what we’ve seen historically, and skips over to a different service to quote and generate a label.
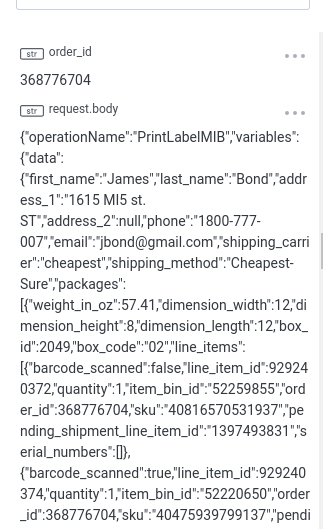
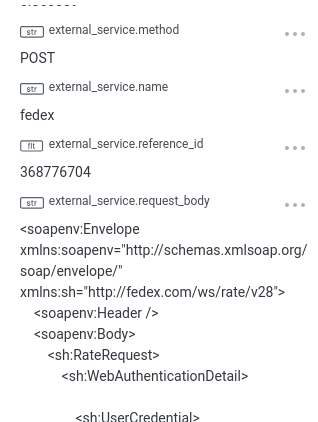
We can drill down and look at the exact request that came from our application and inspect the weight of the package, what items are shipping, and shipping details:
As we follow along, we can drill into each shipping carrier we got a quote from before deciding which one’s best for this shipment:
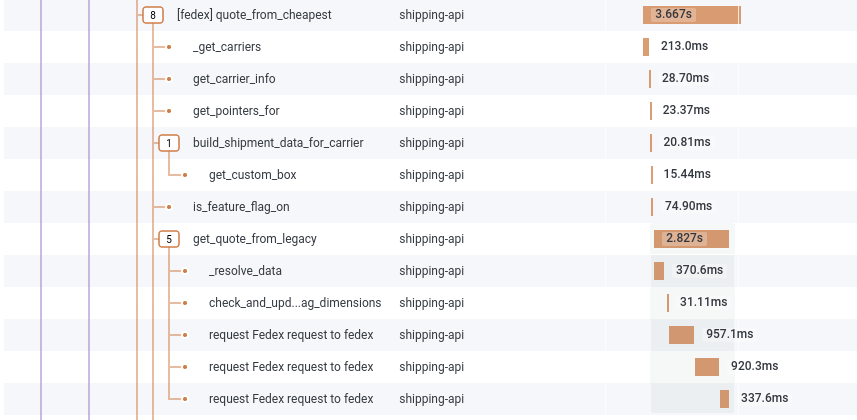
Need to understand what happened between our system and FedEx? No problem — let’s eyeball some XML!
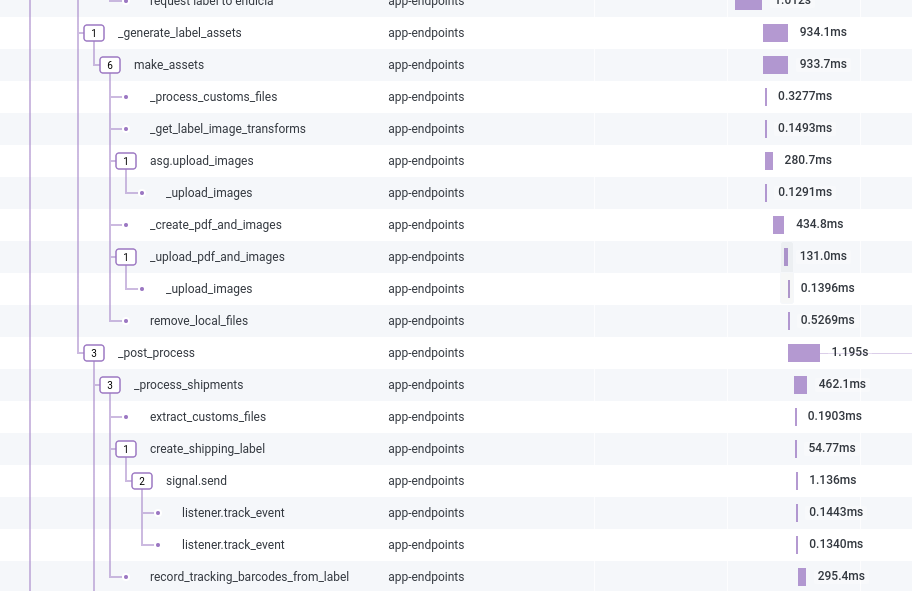
As we cycle through all the configured carriers, we can see one’s been selected and it bounces off to a different service again to create the label:
Creating a label requires a lot of back-and-forth — pulling it in, manipulating it, storing it, cleaning up after ourselves on disk, creating barcode files, and sending it to the correct printer:
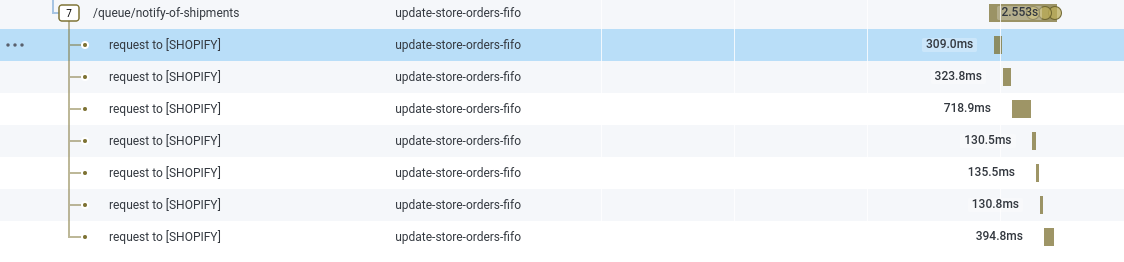
This continues to hop between services until we finally let Shopify know the order has been shipped and what the tracking number is:
Observability Power-Up#
For each and every one of those steps, we can drill into:
- What our request was
- The response
- How long that step took
- What happened before
- What happened after
- And much more
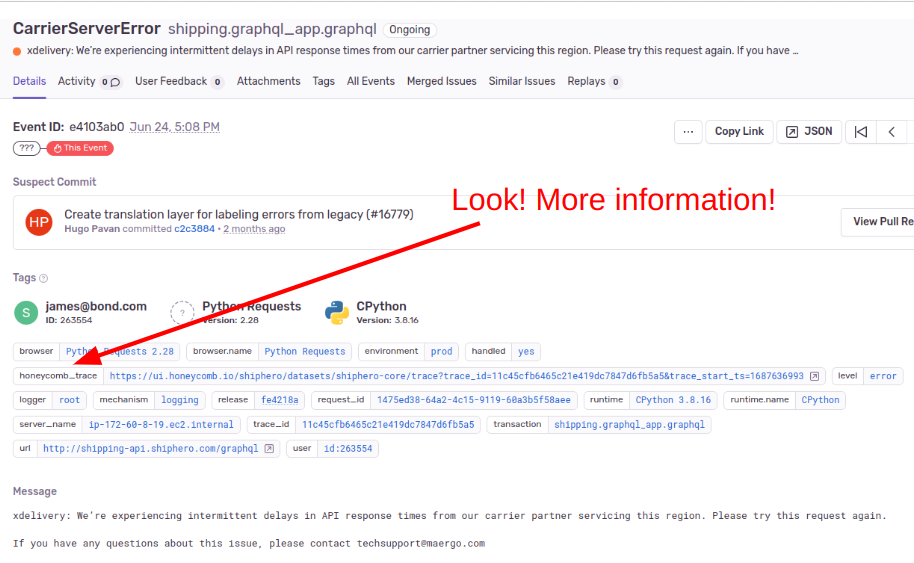
We can also go from a Sentry error to a trace to get the full context of what’s going on by abusing the use of tags:
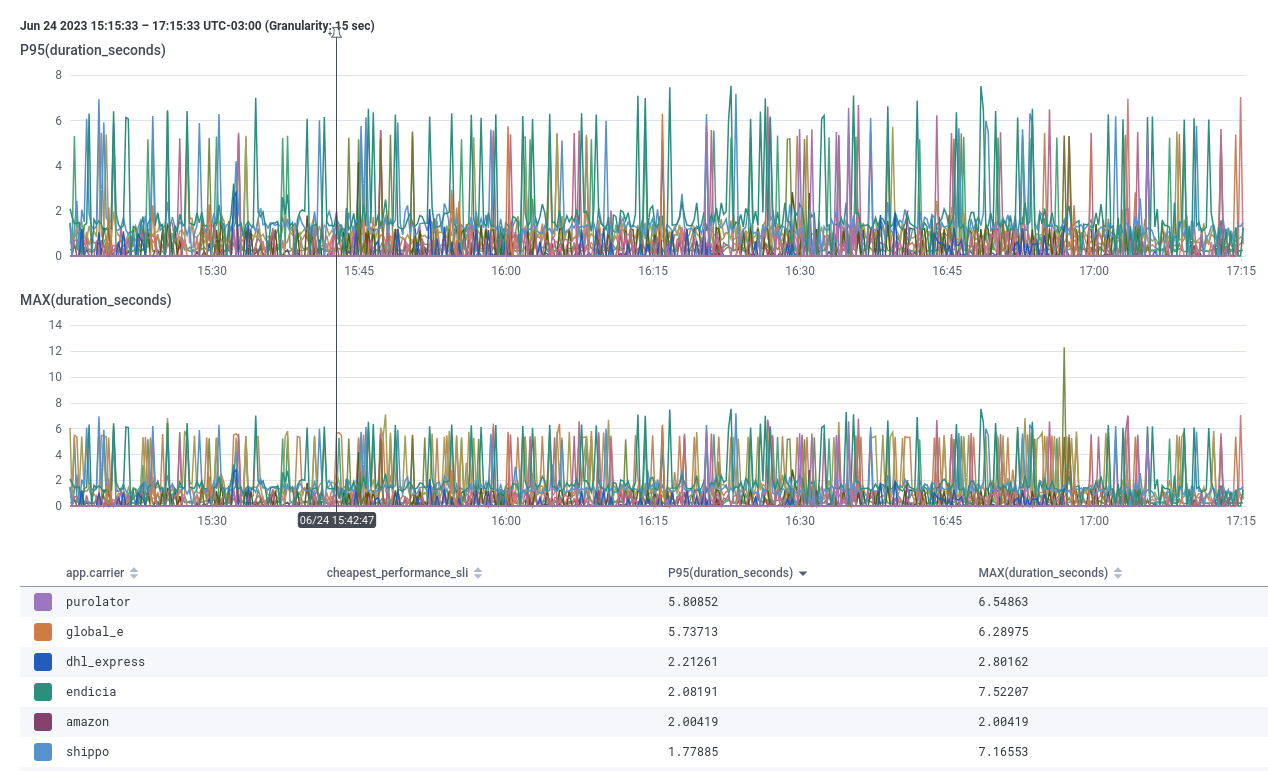
How about zooming out even more and seeing if any shipping carrier’s API is slower than usual?
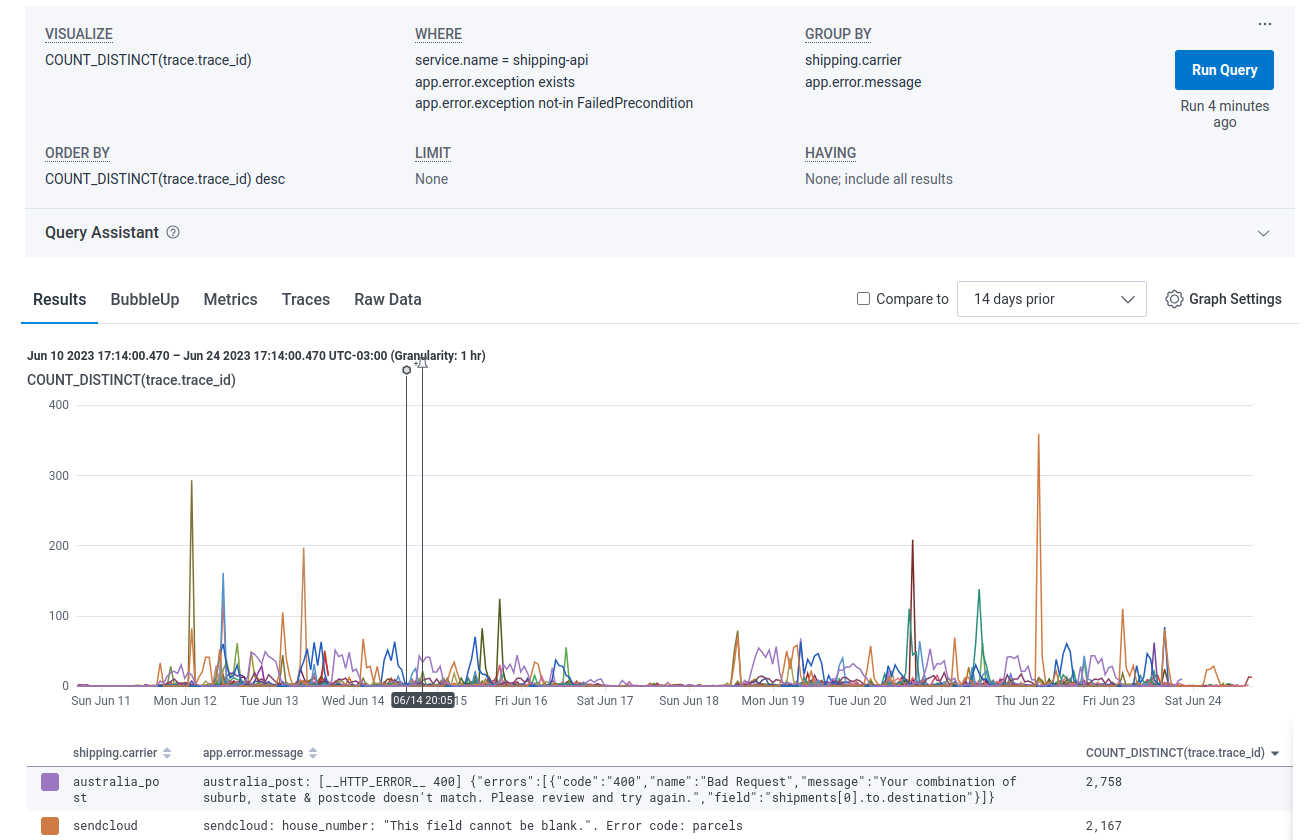
Or maybe what errors are we seeing right now?
Using metrics (specifically traces) instead of logs has helped us reduce debugging time, improve visibility across services, and build a more resilient system.
Looking back, it feels obvious. Moving forward, it’s the new baseline.
This is just a tiny slice of how we debug. What makes this approach so powerful — and so hard to replicate with logs — is a few key things:
The ability to zoom in and out during a bug-hunting session, following threads across services with ease.
Distributed tracing feels like cheating — it turns overwhelming complexity into something you can actually navigate.
A key/value format with a powerful search engine lets you slice and dice data any way you want. Got a vague report like “this only happens to orders starting with ‘QC-’”? No problem — just toss that into a query and see what pops up.
So, what happened to the logs? We didn’t stop producing or storing them — they still go into a cheap S3 bucket in case we missed something in our instrumentation or need to investigate a security incident. But the truth is, we haven’t really had to look at them since.
Making debugging in production easy is a superpower. And really — who doesn’t want a superpower?